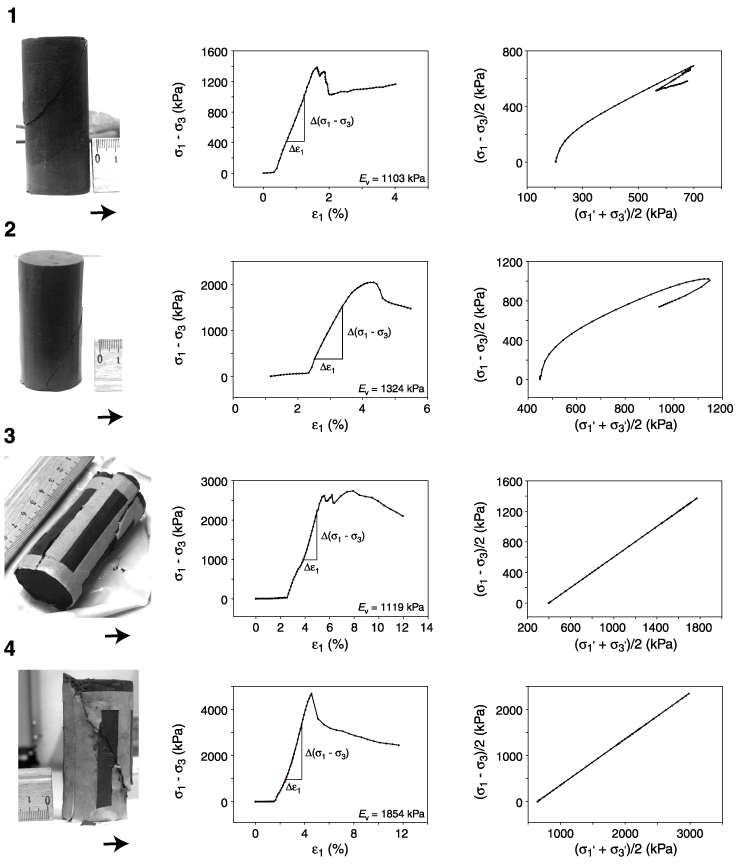
Plate P3. Photographs of samples after testing and measurement results of the experiments (graphs showing differential stress vs. strain curves and stress paths). 1. Section 186-1151A-51R-1, sample 1. 2. Section 186-1151A-51R-1, sample 2. 3. Section 186-1151A-84R-2, drained experiment. Photograph shows sample with filter paper. 4. Section 186-1151A-84R-2, drained experiment. Photograph shows sample with filter paper.


![]()