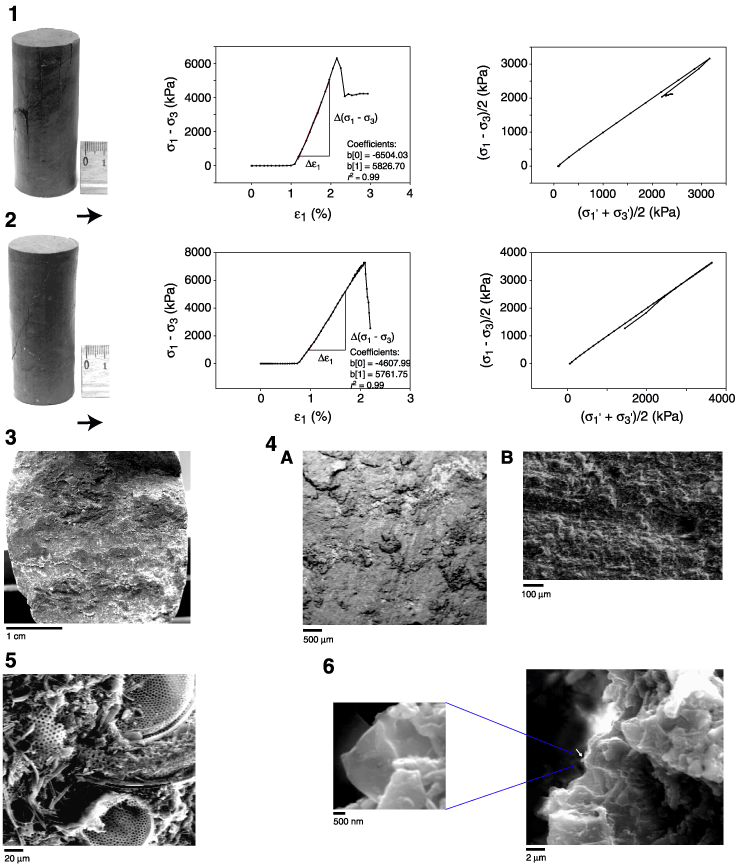
Plate P4. Photographs of samples after testing and measurement results of the experiments (graphs showing differential stress vs. strain curves and stress paths). 1. Section 186-1151A-107R-2, sample 1. 2. Section 186-1151A-107R-2, sample 2. 3. Section 186-1151A-51R-1, sample 1. View of the fracture plane after triaxial test. 4. Section 186-1151A-51R-1, sample 1, SEM picture. (A) Shows striae oriented downdip (BSE mode) with (B) detail of (A) showing fossil remains impressed into the matrix at the end of the striae. 5. Section 186-1151A-51R-1, sample 1, SEM picture. Example of the open pore voids between the fossils. 6. Section 186-1151A-51R-1, sample 1, SEM picture. Accumulation of clay minerals. Detail shows a single platelet.


![]()