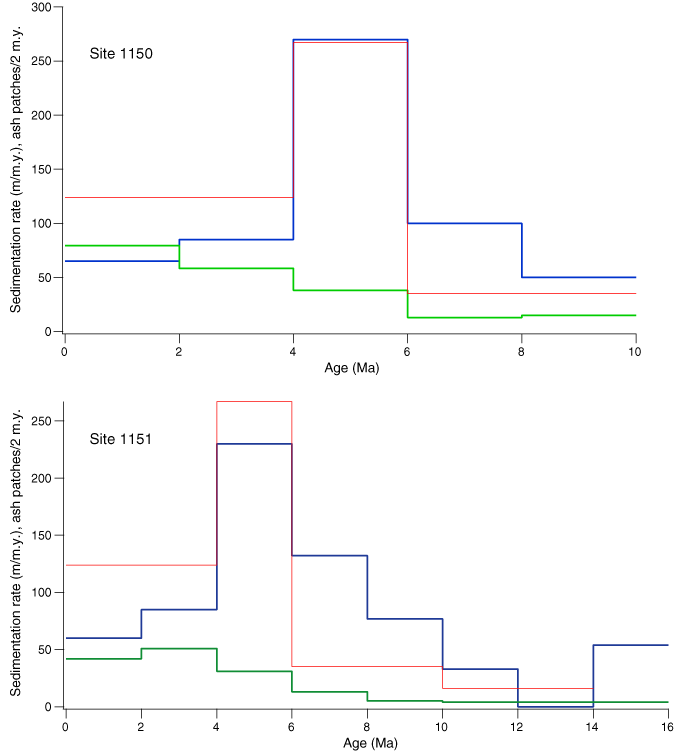
Figure F13. Summary diagram showing relation of sedimentation rate and volcanic flux to age for Sites 1150 and 1151. Blue = corrected sedimentation rate, green = number of ash patches per 2 m.y., red = model sedimentation rate from the square of the coupling length.


![]()