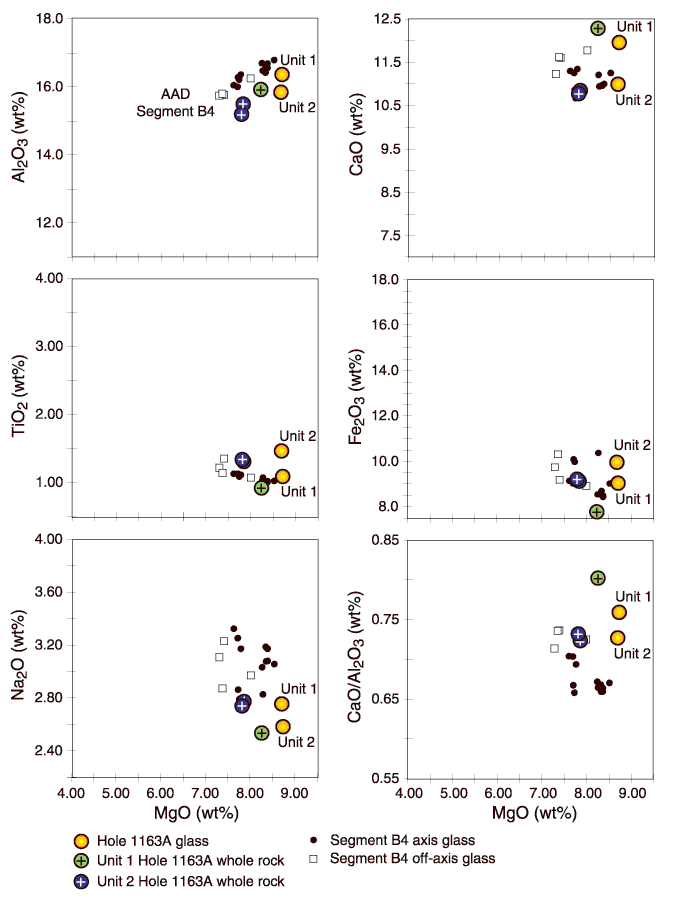
Figure F20. Major element compositions vs. MgO of basalts from Holes 1163A and 1163B compared with glasses from Segment B4. Only the average X-ray fluorescence or ICP-AES analyses reported in Table T3 are plotted.