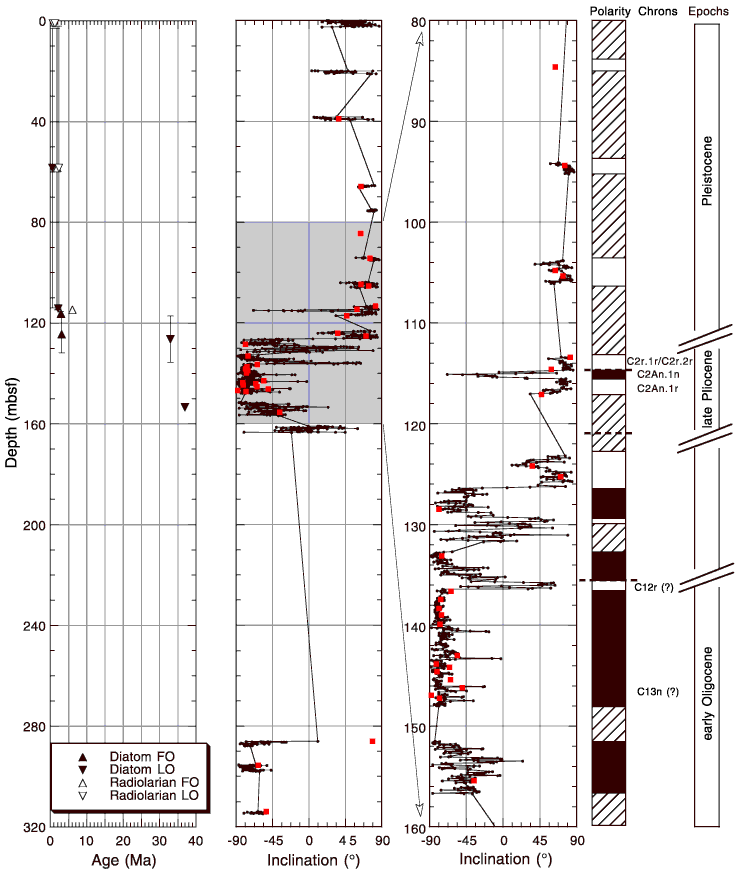
Figure F13. Plots showing biostratigraphic age control and magnetostratigraphic polarity intervals for Site 1166. FO = first occurrence and LO = last occurrence. The inclinations obtained from split cores are compared with inclinations from stepwise-demagnetized discrete samples (solid squares). Polarity is shown on the log to the right. Black represents normal and white represents reversed polarity intervals.

![]()