![]() Figures F1-F16
Figures F1-F16
![]() Tables
T1-T5
Tables
T1-T5
F1. Coring and depth intervals.
F2. Examples of numbered core sections.
F3. Key to symbols used in Leg 188 barrel sheets.
F4. Classification scheme for siliciclastics and procedure for naming mixtures of biogenic and siliciclastic sediments.
F5. Classification of poorly sorted sediments with a gravel component.
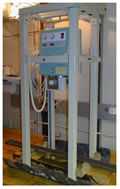
F6. The X-ray unit in the entry area of the core laboratory.
F7. Holocene through Paleogene time scale with foraminifer and nannofossil biostratigraphic datums.
F8. Southern Ocean diatom zonal scheme plotted against the geomagnetic polarity time scale.
F9. Cenozoic radiolarian biostratigraphic zonal schemes.
F10. Comparison of the response curves for the shipboard cryogenic superconducting DC-SQUID magnetometer.
F11. Total magnetic field measured inside the TSD-1 oven with a fluxgate magnetometer.
F12. Core-orientation conventions for split core and discrete cylindrical sample.
F13. Response curve for the magnetic susceptibility loop on the MST position.
F14. Wireline tool strings used during Leg 188.
F15. Schematic diagram of the LWD BHA.
F16. Schematic diagram of the FMS.
T1. Oligocene to Pleistocene diatom zonal ages.
T2. Ages of biostratigraphically useful radiolarian datums.
T3. Wireline tool strings used during Leg 188.
T4. Acronyms used to describe LWD and MWD tools.
T5. Acronyms used to describe wireline tool strings and tool names.