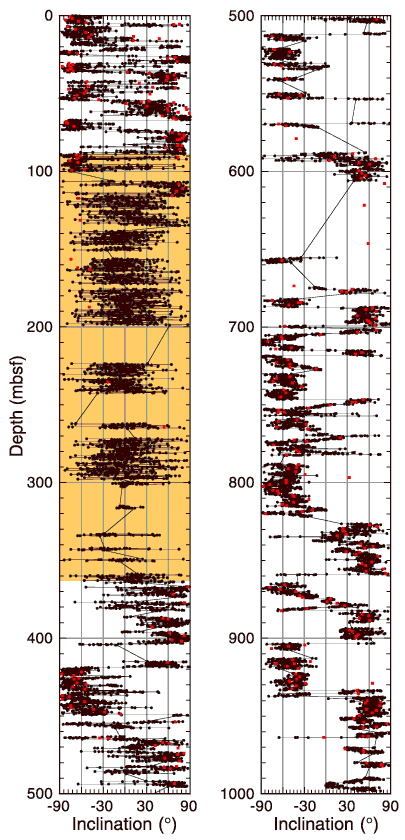
Figure F34. Inclination record for the composite section of Holes 1165B and 1165C (0-999.1 mbsf) after demagnetization at 20-30 mT. The inclinations from split-core measurements (solid circles) are compared to inclinations from stepwise-demagnetized discrete samples (solid squares). Inclinations for discrete samples were determined by linear regression fits to multiple demagnetization steps. The shaded area represents the interval (94-362 mbsf) depleted in magnetic minerals.

![]()