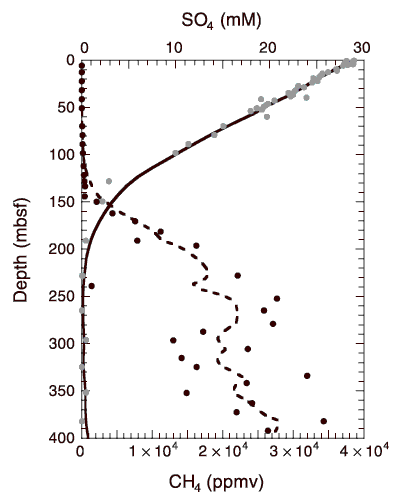
Figure F44. Downhole profiles of dissolved sulfate (shaded circles) and headspace methane (solid circles) for the upper 400 m of Site 1165. The downhole shift from SO4 reduction to CO2 reduction is evident at ~150 mbsf. Data are reported in Table T7 and Table T8.
![]()