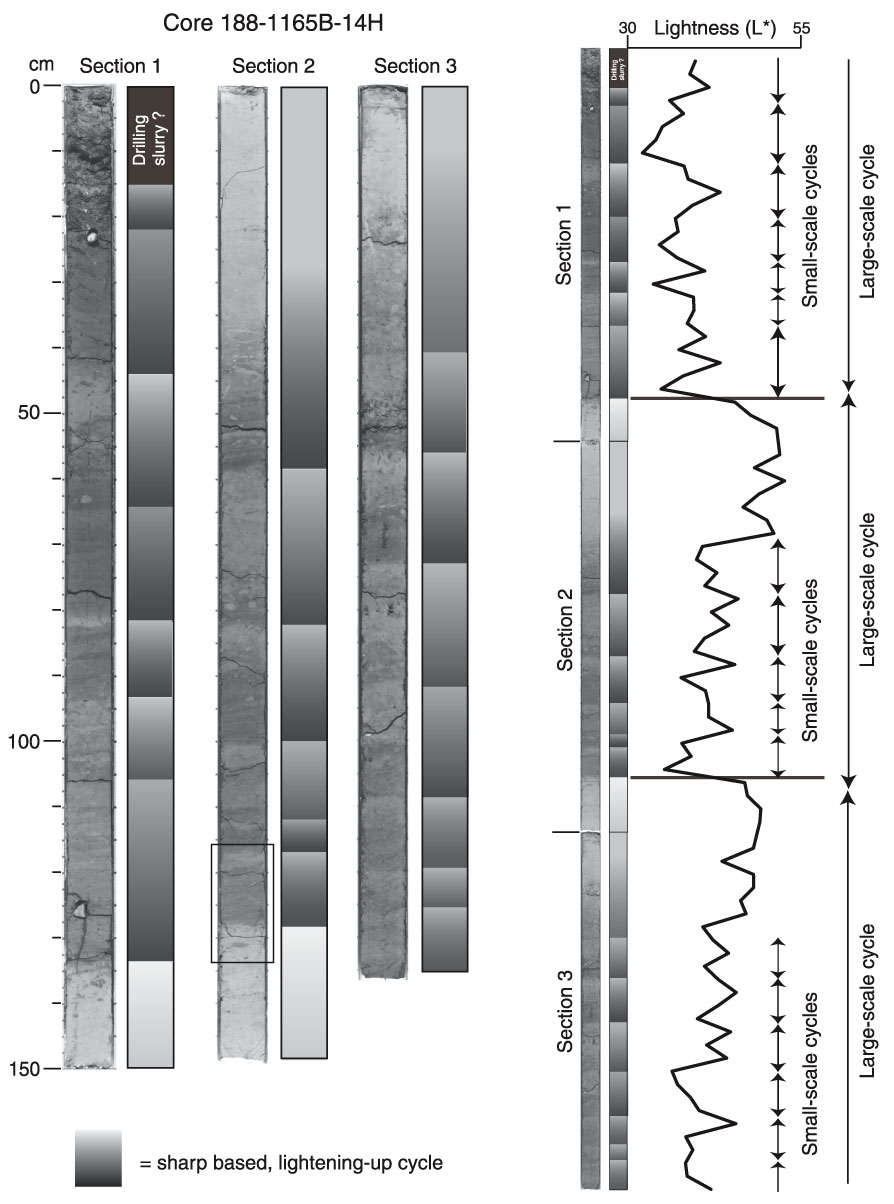
Figure F54. Example from Core 188-1165B-14H showing color cycles (i.e., dark to light couplet). There are large-scale cycleshere ~1.5 mand small-scale cycles that are shorter and generally lie in the darker areas of the core. The curve on the right shows lightness values measured by the spectrophotometer.
![]()