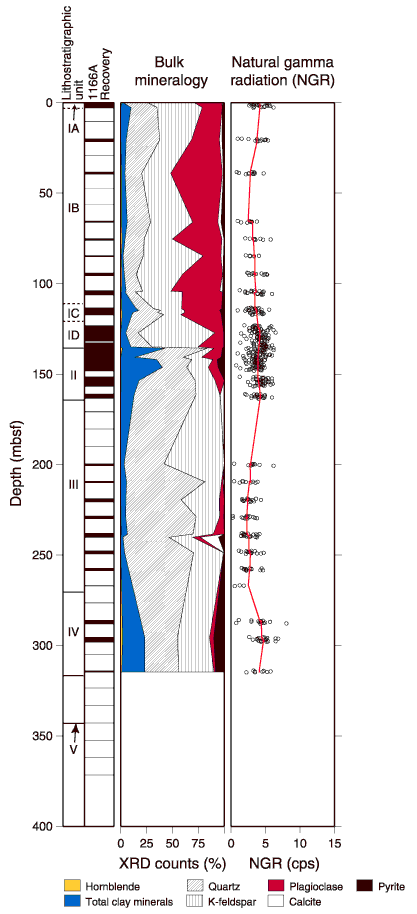
Figure F32. Plots showing bulk mineralogy from X-ray diffraction (XRD) and natural gamma radiation (NGR) vs. depth at Site 1166. Core recovery and lithostratigraphic units are shown on the left. The line through the NGR data is a 20-m moving average.

![]()