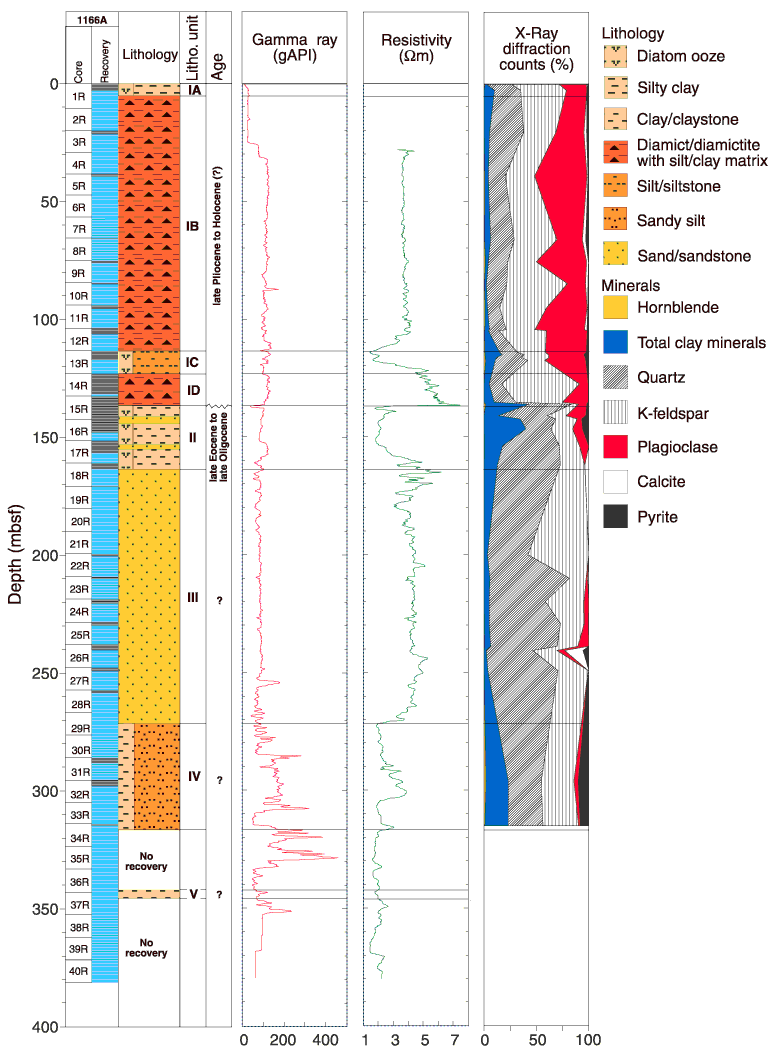
Figure F4. Composite stratigraphic section for Site 1166 showing core recovery, a simplified summary of lithology, lithologic unit boundaries, and age. Gamma-ray and resistivity curves are derived from wireline logs (see "Downhole Measurements") along with minerals identified by XRD. XRD shows the percentage of most abundant minerals. This graph was plotted using the methods of Forsberg et al. (1999).

![]()