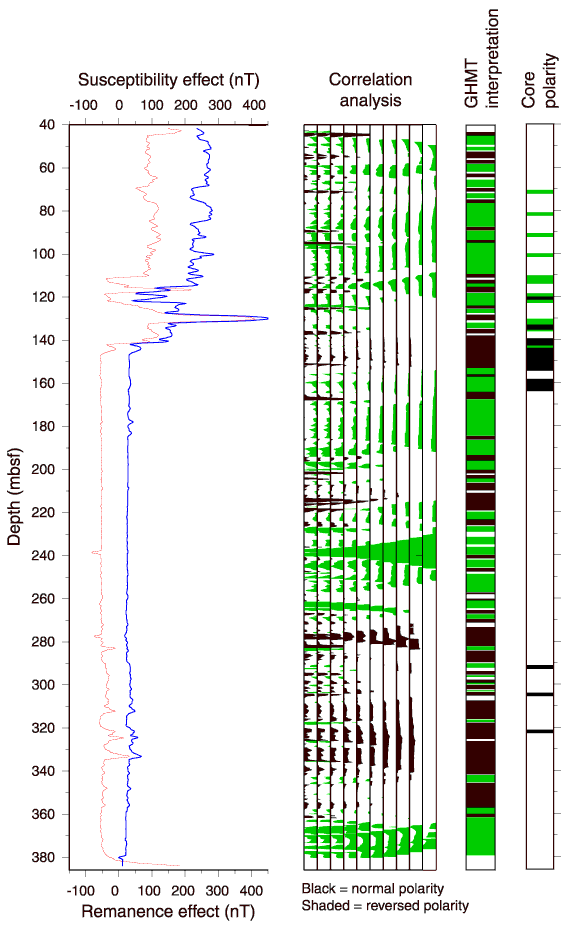
Figure F48. Processed GHMT logs. The remanent and induced (susceptibility) components of the total field measurement and a correlation analysis are plotted. Where the remanent and induced curves correlate, the polarity is normal; where they anticorrelate, the polarity is reversed. Ten interval thicknesses were used for this analysis. An interpretation of the correlation analysis is plotted along with the available core paleomagnetization.

![]()