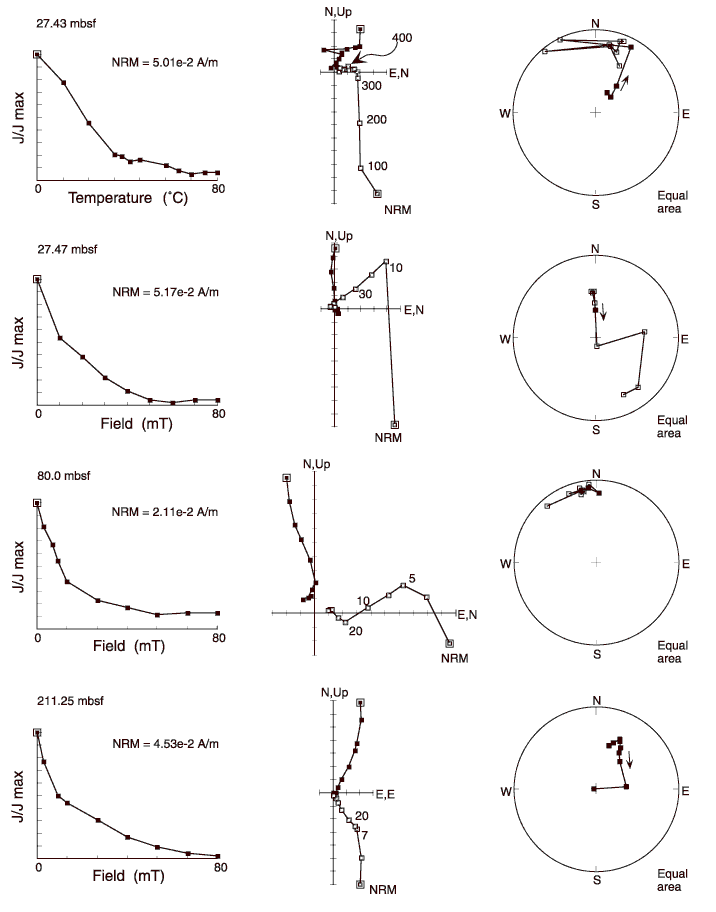
Figure F24. Vector component diagrams (with normalized intensity decay plots) of demagnetization (AF) behavior of four samples from Hole 1167A. Open symbols = projections onto the vertical plane; solid symbols = projections onto the horizontal plane. Numbers denote demagnetization levels in milliteslas and in degrees Celsius. Dashed lines = linear regression fits that indicate the characteristic remanence component for each sample. The stereoplots are equal-area projections, with open symbols indicating upper hemisphere projections and solid symbols indicating lower hemisphere projections. The core is not azimuthally oriented; therefore, the declination values are not meaningful. NRM = natural remanent magnetization.

![]()