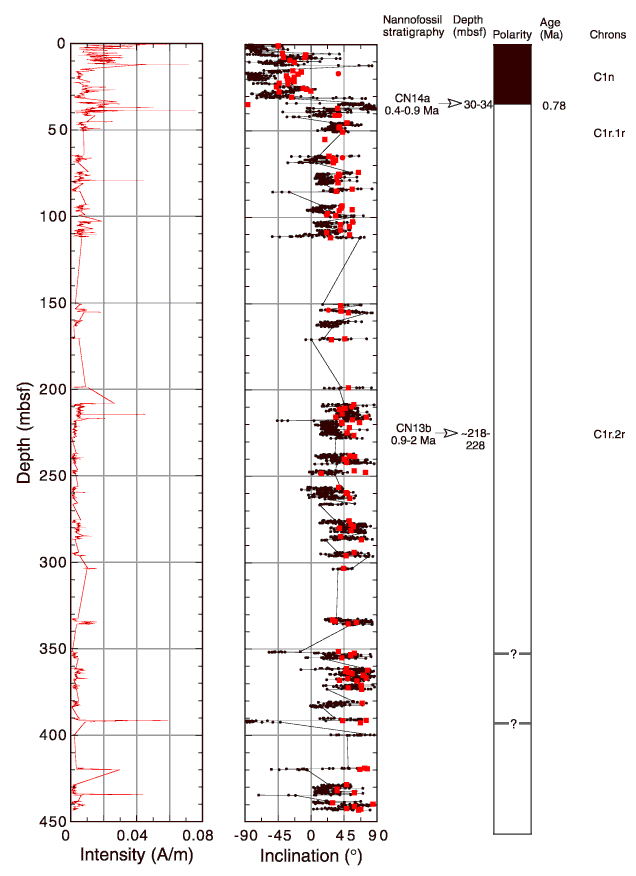
Figure F25. Magnetostratigraphic record from Hole 1167A. Plot of NRM intensity and inclination after demagnetization at 30 mT. The inclinations obtained from split cores (solid circles) are compared with inclinations from stepwise-demagnetized discrete samples (solid squares). Inclinations for discrete samples were determined by linear regression fits to multiple demagnetization steps. Polarity is shown on the log to the right. Black = normal polarity intervals; white = reversed polarity intervals. The depths of the two nannofossil assemblages are also indicated.
![]()