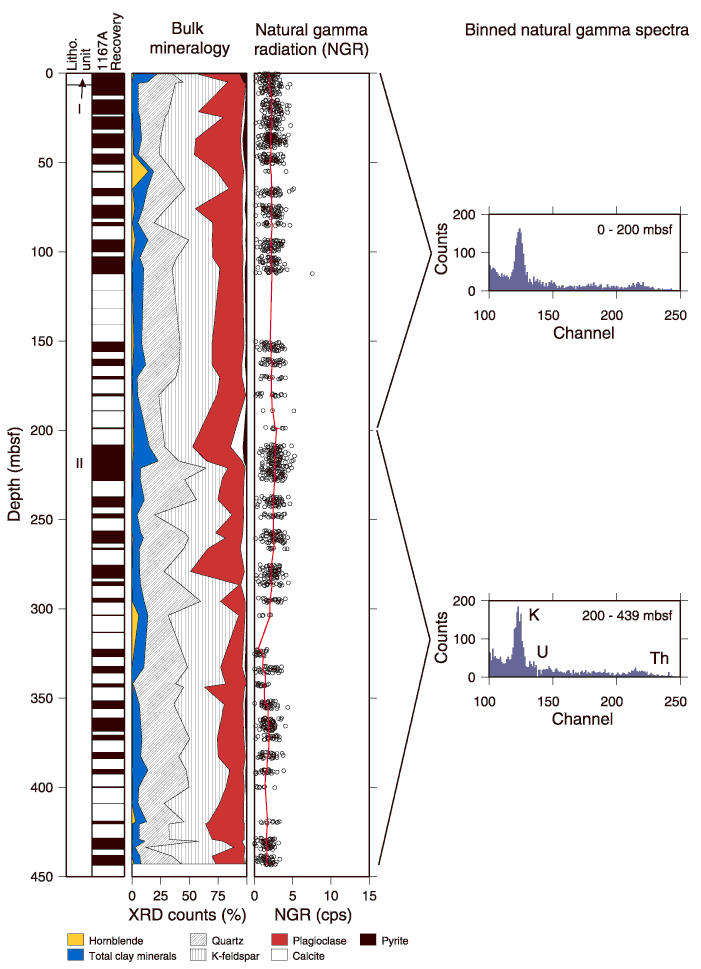
Figure F29. Plots showing bulk mineralogy from X-ray diffraction (XRD), NGR, and binned natural gamma spectra vs. depth at Site 1167. Core recovery and lithostratigraphic units are shown on the left. The line through the NGR data is a 20-m moving average. The binned NGR spectra show channels 100 through 248 (1.16-2.99 MeV) from the MST natural gamma detector. The characteristic peak positions of gamma radiation associated with potassium (K), uranium (U), and thorium (Th) are shown on the lowermost spectrum.

![]()