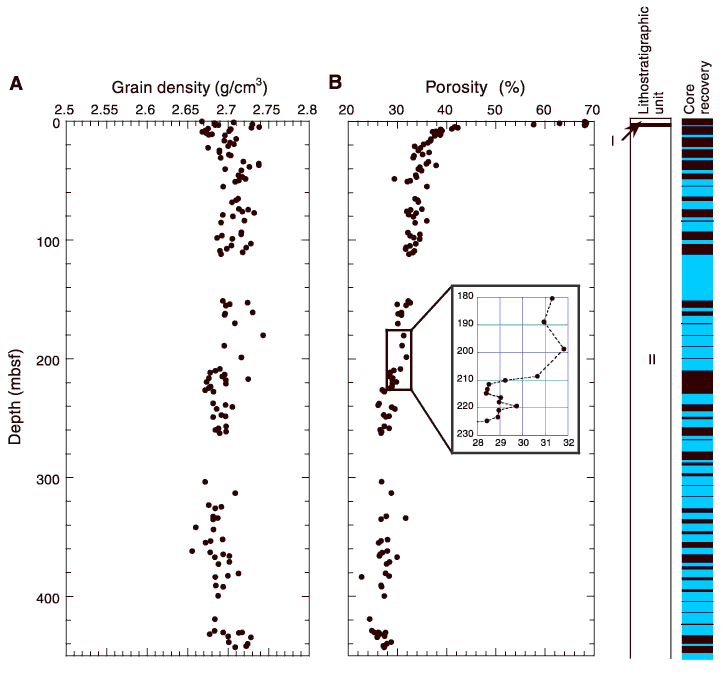
Figure F30. (A) Grain density and (B) porosity from discrete measurements. The inset detail of the data points around 210 mbsf shows the distinct decrease of porosity seen at that depth. The columns on the right show lithostratigraphic units and core recovery.

![]()