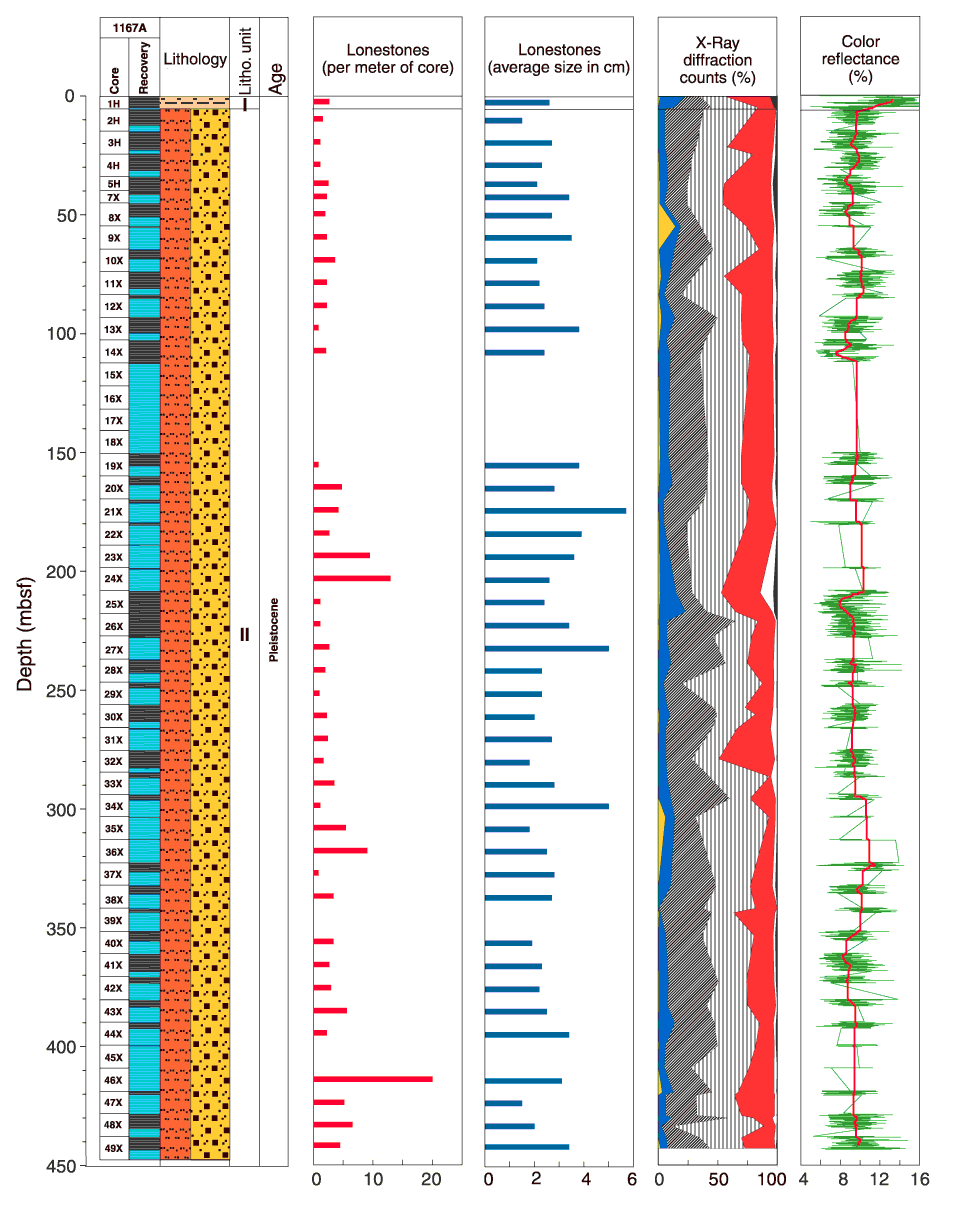
Figure F4. Composite stratigraphic section for Site 1167 showing core recovery, a simplified summary of lithology, lithologic unit boundaries, and age. Lithologic symbols are explained in Figure F3 in the "Explanatory Notes" chapter. Also shown are lonestone distribution and average size, minerals identified by XRD, and color reflectance. XRD shows the percentage of most abundant minerals. See Figure F12 in the "Leg Summary" chapter for lithology and mineral legends. This graph was plotted using the methods developed by Forsberg et al. (1999). The thin line in the color reflectance shows the percent reflectance downhole (L*). The thick line is a 200-point moving average.

![]()