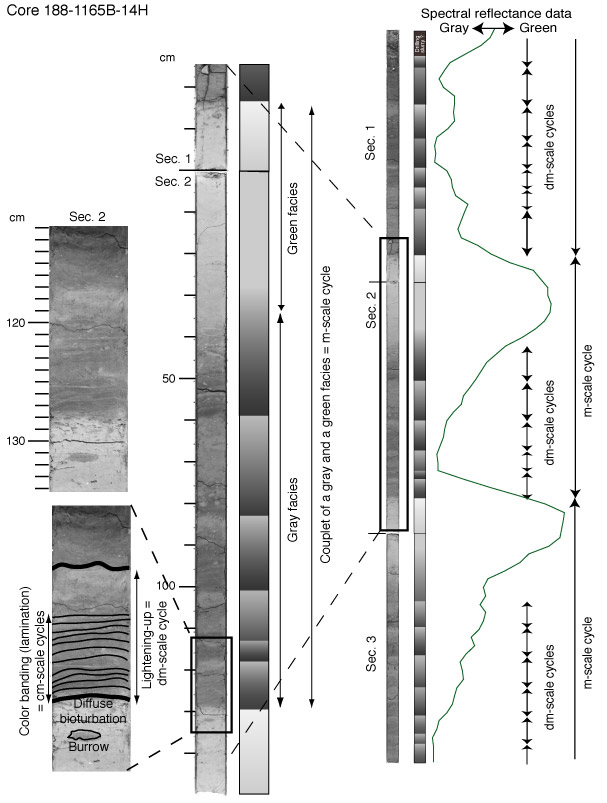
Figure F4. Composite diagram showing the complex rhythmic sedimentation with cycles at different (centimeter to meter) scales nested together within Core 188-1165B-14H (modified after Rebesco et al., 2001). The centimeter-scale cycles are revealed by color banding and lamination (see the interpreted black-and-white photo in the left bottom). Such cycles are included within decimeter-scale cycles characterized by lightening-upward intervals. In turn, these cycles are included within gray facies (see the black-and-white photo in the center and the synthetic interpretation on its right). Finally, meter-scale cycles are constituted by a couplet of gray and green facies. The decimeter- and meter-scale cycles are precisely recorded by diffuse spectral reflectance data (see the ratio of the reflectivity in the green color band vs. the average reflectivity on the right side of the diagram). Moreover, larger-scale (several decameters) cycles (not shown here) are produced by the variation in ratio between the thickness of the two
facies.


![]()