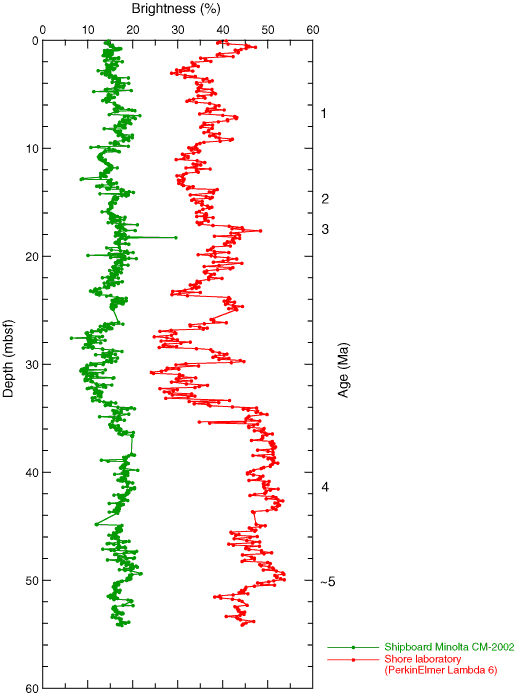
Figure F7. Curves showing changes in brightness down the HiRISC section (0-54 mbsf) of Hole 1165B. The red curve was determined from dry, ground-up core samples using the PerkinElmer Lambda 6 spectrophotometer, whereas the green curve was determined from shipboard measurements on wet cores using the Minolta CM-2002 spectrophotometer (see Damuth and Balsam, this volume, their table
T2,
for sample locations and values).