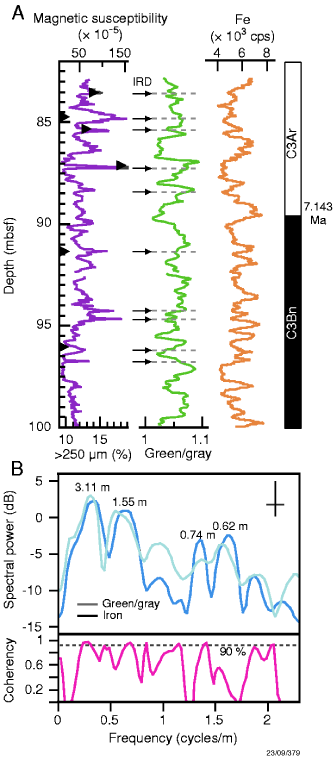
Figure F11. Data curves for the upper part of Site 1165 (80–100 mbsf) illustrating apparent Milankovitch-frequency fluctuations (from Grützner et al., 2003). A. data plots of magnetic susceptibility, green/gray color ratio, and Fe-intensity data. Triangles = samples with >10% sand-sized particles (i.e., >250 µm), arrows = ice-rafted debris (IRD) layers. Magnetostratigraphic age control is shown at right. B. Cross-spectral analyses of green/gray ratios and Fe records in depth domain. Peaks shown correspond to cycles of 84.1, 41.9, 20.0, and 16.8 k.y. durations.