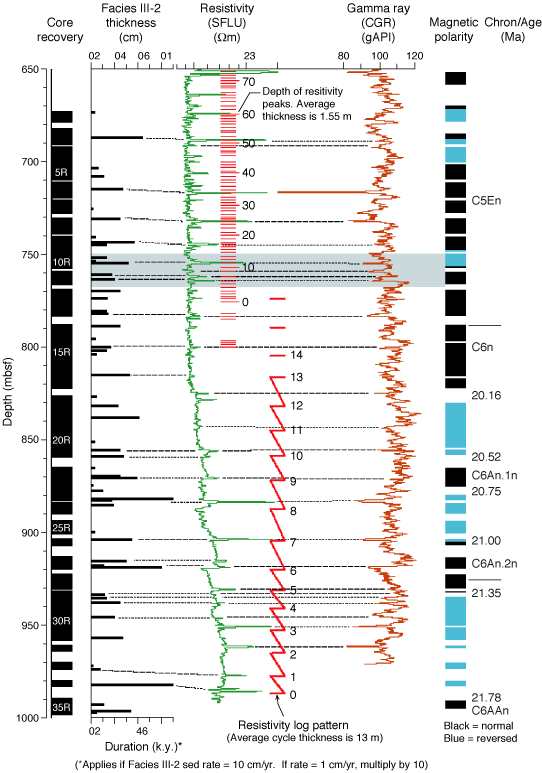
Figure F12. Data profiles for the lower part of Site 1165 illustrating cyclicity in downhole logging data from Williams et al. (2002, pers. comm., 2004). The figure shows core recovery, Facies III-2 (predominately silicious claystone), resistivity data, gamma radiation data, magnetostratigraphic boundaries, and vertical spacing of resistivity peaks (i.e., cycle thickness). SFLU = spherically focused resistivity, CGR = computed gamma ray.


![]()