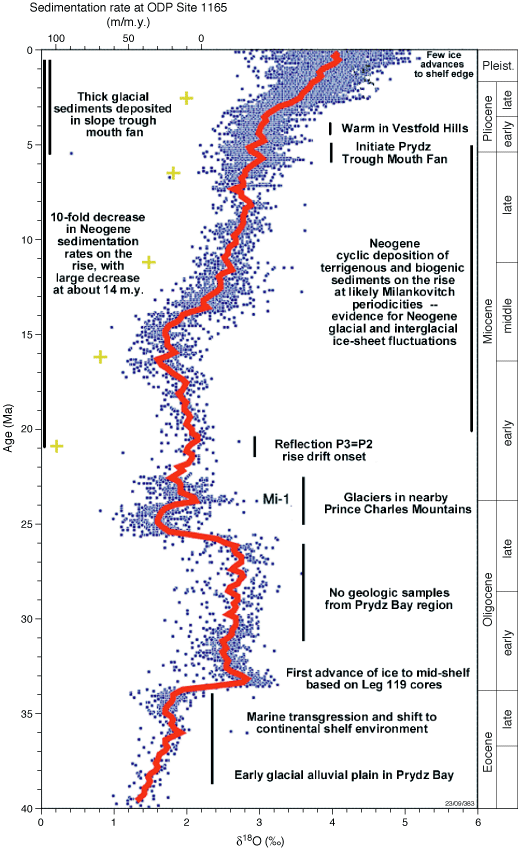
Figure F15. Summary diagram showing geologic and glacial events in the Prydz Bay region, compared with the global oxygen isotope curve of Zachos et al. (2001). Sedimentation rates are from Shipboard Scientific Party (2001b) and Florindo et al. (2003a). Transitions in the Prydz Bay region have both long-term and short-term components like those of the isotopic curve. Long-term decreases in the middle Miocene and younger sedimentation rates on the continental rise mimic the pronounced cooling trend of the global oceans.


![]()