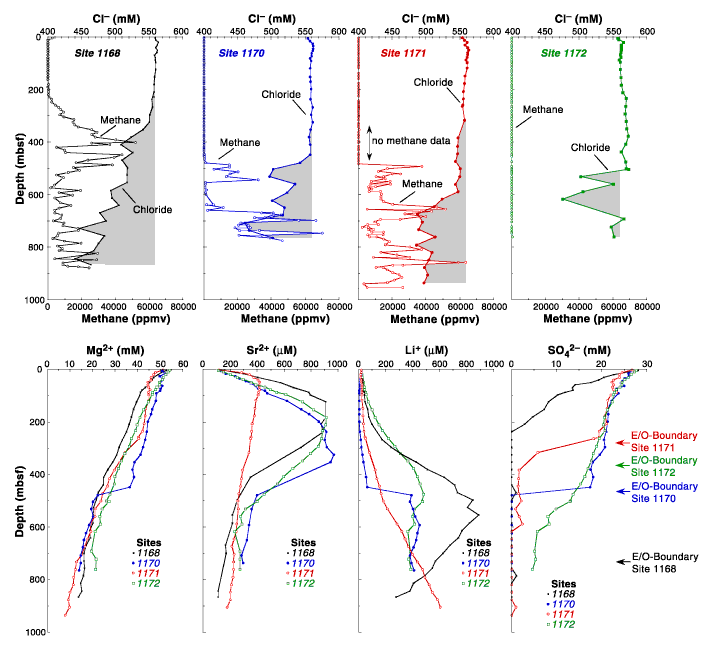
Figure F23. Summary of interstitial water geochemistry results for Sites 1168, 1170, 1171, and 1172. The upper panel shows Cl- and methane profiles. Intervals with Cl- values less than mean seawater (i.e., fresher waters) are shaded. The lower panel shows concentration-depth profiles for selected interstitial water constituents. The approximate location of the Eocene/Oligocene (E/O) boundary is also shown.

![]()