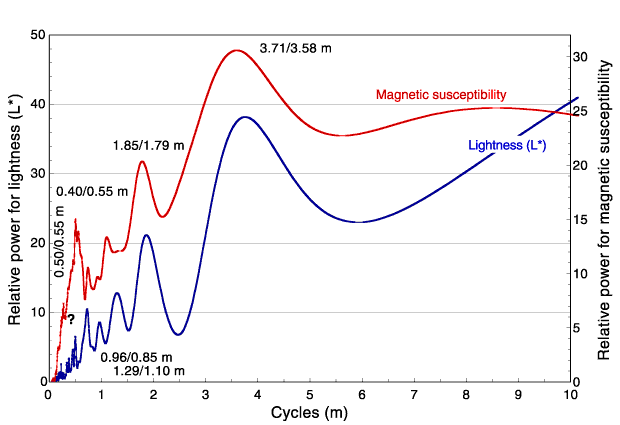
Figure F10. Power spectra of lightness (L*) for the interval from 2 to 23 mbsf in Hole 1168A. The spectral analysis of lightness (L*) and magnetic susceptibility time series is based on the Blackman-Tukey method using a Fourier transformation. Both spectra show cycles in comparable lengths of 3.71 and 3.58 m for the most dominant and 1.85 and 1.79 m for the secondary cycle. [N1]

![]()