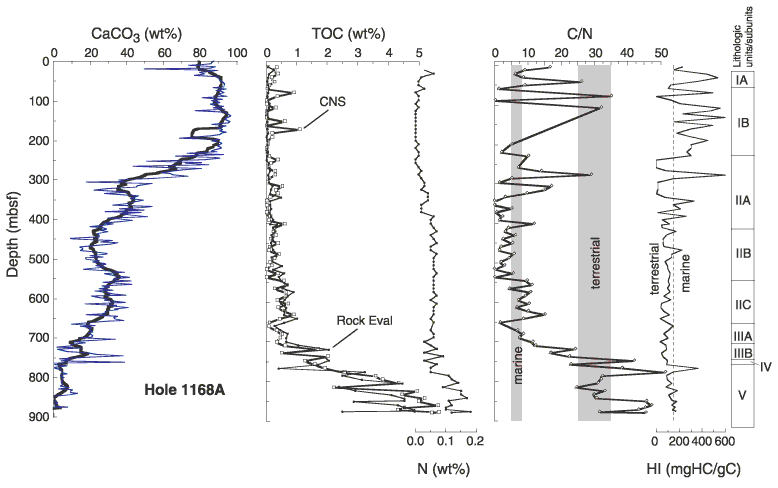
Figure F27. Plots of carbonate (thin line = raw data; solid line = smoothed data), total organic carbon (TOC) (squares = CNS analyzer data; dots = Rock-Eval pyrolysis values), and total nitrogen, C/N ratios, and hydrogen index values for Hole 1168A. Shaded areas on the C/N ratio plot delineate typical marine and terrestrial organic matter fields. Lithostratigraphic units are indicated on the far right side of the figure.

![]()