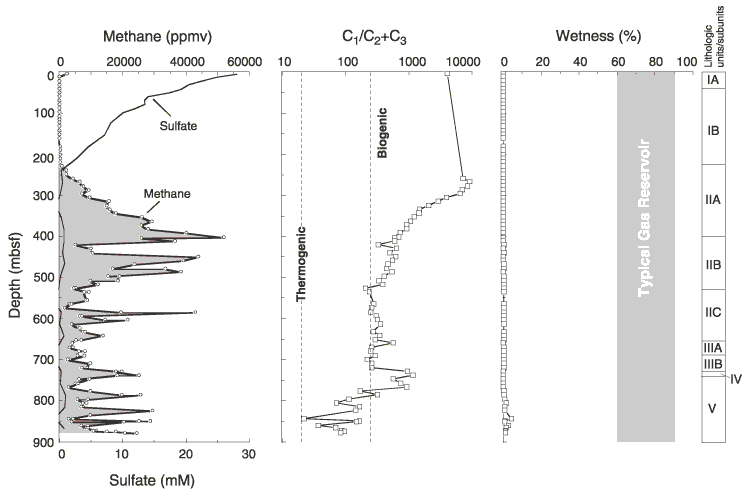
Figure F31. Methane (C1) concentrations, methane vs. ethane plus propane ratios (C1/C2+C3), and the percent wetness ([C2+C3/C1+C2+C3]100) from headspace gas analysis. Dashed lines delineate biogenic and thermogenic fields on the C1/C2+C3 plot (Hinz et al., 1986), whereas the shaded area on the percent wetness plot marks values typical for economically viable gas reservoirs.

![]()