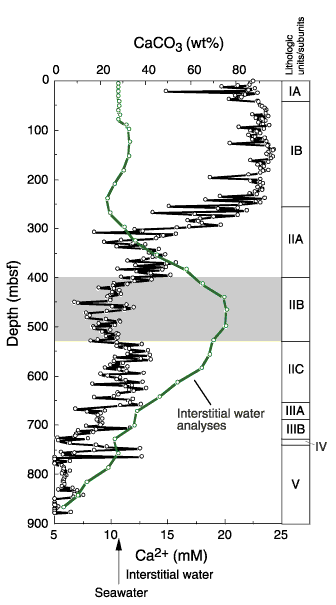
Figure F34. Concentration of Ca2+ (green line) compared to the weight percent CaCO3 with the approximate location of lithostratigraphic boundaries (see "Lithostratigraphy"). Shaded interval highlights the lithostratigraphic Subunit IIB, where maximum interstitial Ca2+ values coincide with low weight percent CaCO3.
![]()