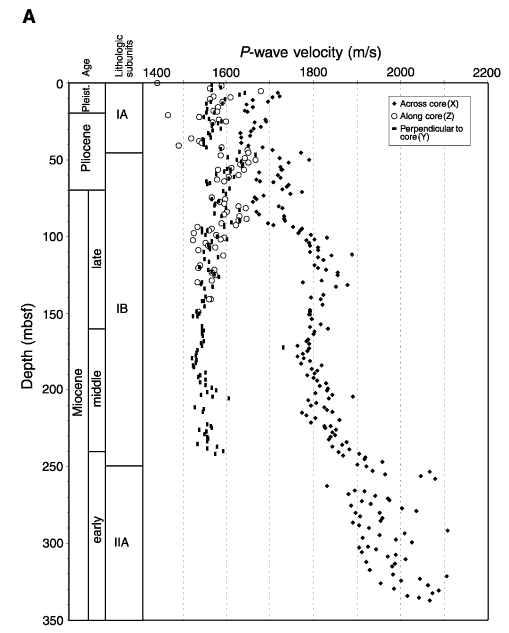
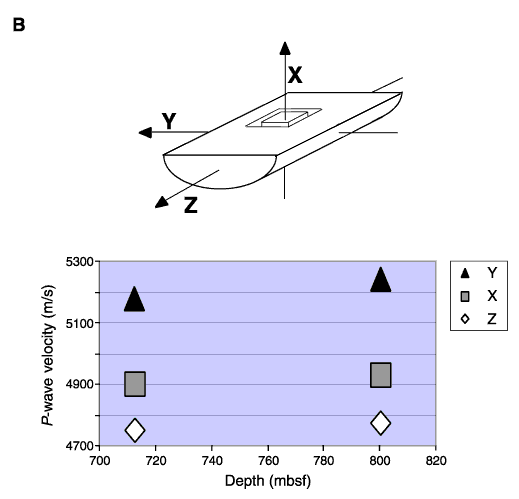
Figure F38. A. P-wave velocities (PWS1, PWS2, and PWS3) measured for discrete samples vs. depth. B. Three-dimensional P-wave velocities (Hamilton frame, PWS3) measurements for cemented sandstone sample cubes from Cores 189-1168A-72X and 86X vs. depth exhibit inhomogeneities because of the intensive cementation. Directions x and y were both measured along the bedding, y velocities are relatively faster. Direction z (perpendicular to the bedding) exhibits the slowest velocities. The top figure illustrates the three directions of measurement.


![]()