![]() Figures F1-F19
Figures F1-F19
![]() Tables
T1-T17
Tables
T1-T17
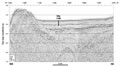
F1. A portion of seismic line Tasmante 125-04 through Site 1169.
F2. Lithostratigraphic summary.
F3. Physical and chemical properties.
F4. Site 1169 age-depth plot and linear sedimentation rates.
F5. Color changes associated with water temperature shift.
F6. Paleodepth and interpretation of bottom-water conditions, based on benthic foraminiferal assemblages.
F7. Long-core results showing limited magnetostratigraphy for the late Pliocene and early Pleistocene.
F8. Magnetic characteristics for two samples.
F9. Plots of carbonate, total organic carbon, total nitrogen, and C/N ratios, Hole 1169A.
F10. Concentration-depth profiles of Cl- and Na+.
F11. Concentration-depth profiles of SO42-, pH, and alkalinity.
F12. Concentration-depth profiles of Sr2+, Ca2+, and Li+.
F13. Concentration-depth profiles of Mg2+ and K+.
F14. Concentration-depth profile of dissolved silica within interstitial water.
F15. Magnetic susceptibility, GRA density, and discrete wet bulk density vs. depth, Hole 1169A.
F16. P-wave velocities measured for discrete samples and in whole cores vs. depth.
F17. Shear strength measured on whole cores vs. depth, Hole 1169A.
F18. Thermal conductivity measured on whole cores vs. depth.
F19. Wet bulk density, water content, and porosity measured at discrete intervals vs. depth, Hole 1169A.
T1. Coring summary.
T2. Distribution and abundance of nannofossils.
T3. Calcareous nannofossil datum levels and their assigned age estimates.
T4. Range chart of planktonic foraminifers.
T5. Planktonic foraminifer datum levels, Hole 1169A.
T6. Relative abundance of selected diatom taxa, sponge spicules, and silicoflagellates, Hole 1169A.
T7. Combined bioevents used for age model, Hole 1169A.
T8. Distribution of organic walled dinocysts and percentage of sporomorph and foraminifer linings, Hole 1169A.
T9. Selected age-diagnostic dinocyst event, Hole 1169A.
T10. Magnetostratigraphic results.
T11. Values for inorganic carbon, calcium carbonate, total carbon, total organic carbon, total nitrogen, and C/N in sediments, Hole 1169A.
T12. Headspace gas composition, Hole 1169A.
T13. Interstitial water data, Hole 1169A.
T14. P-wave velocities measured at discrete intervals, Hole 1169A.
T15. Undrained shear strength from miniature vane-shear measurements, Hole 1169A.
T16. Thermal conductivity measured on whole-core sections, Hole 1169A.
T17. Index properties measured at discrete intervals, Hole 1169A.