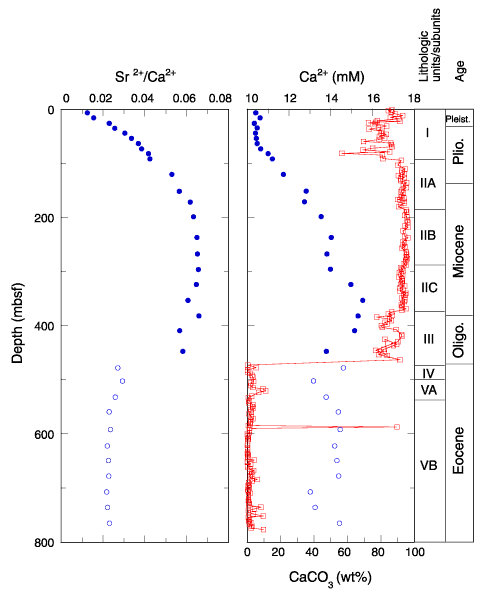
Figure F30. Concentration-depth profile of Sr2+/Ca2+ (solid circles = samples collected from Hole 1170A; open circles = samples from Hole 1170D). Interstitial water Ca2+ (solid blue circles = Holes 1170A; open circles = Hole 1170D) plotted vs. weight percent CaCO3 (red squares). Approximate locations of lithostratigraphic boundaries and ages are also shown (see "Lithostratigraphy" and "Biostratigraphy").
![]()