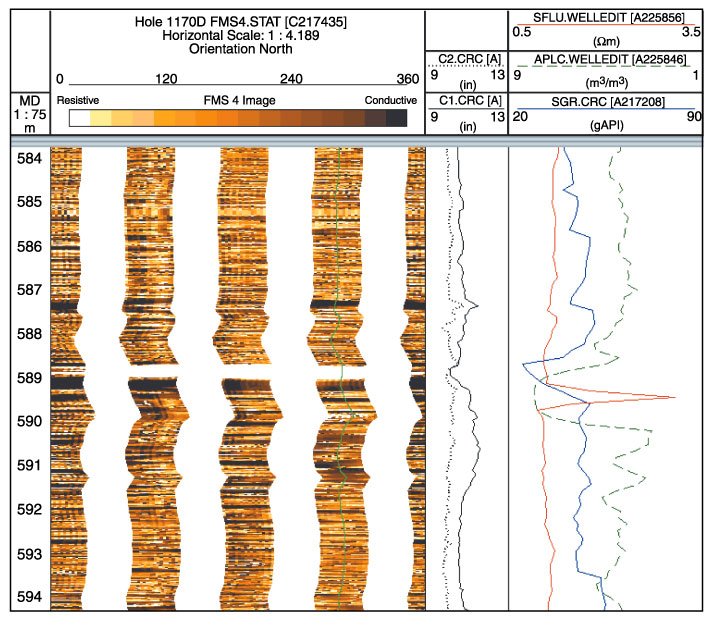
Figure F44. Formation MicroScanner (FMS) image from the top of log Unit 2. The caliper data (C1 and C2), the gamma-ray values (SGR) from this tool string, and the shallow resistivity (SFLU) and neutron porosity (APLC) from the triple-combo tool are also shown. An indurated limestone horizon can clearly be seen at 589 mbsf as a light stripe in the FMS, a decrease in the gamma and neutron porosity, and an increase in the shallow resistivity. There is a slight depth mismatch between the data from the two different tool strings.
![]()