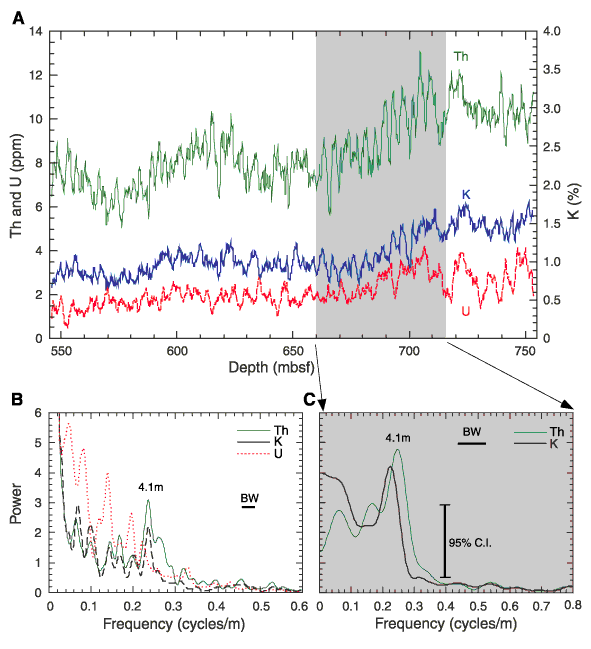
Figure F46. (A) Spectral gamma-ray data and (B, C) preliminary spectral analysis from Hole 1170D. The power spectrum shows the results of spectral analysis over (B) the entire logged section and (C) the interval where Th and K data show the most pronounced cyclicity (660-715 mbsf).
![]()