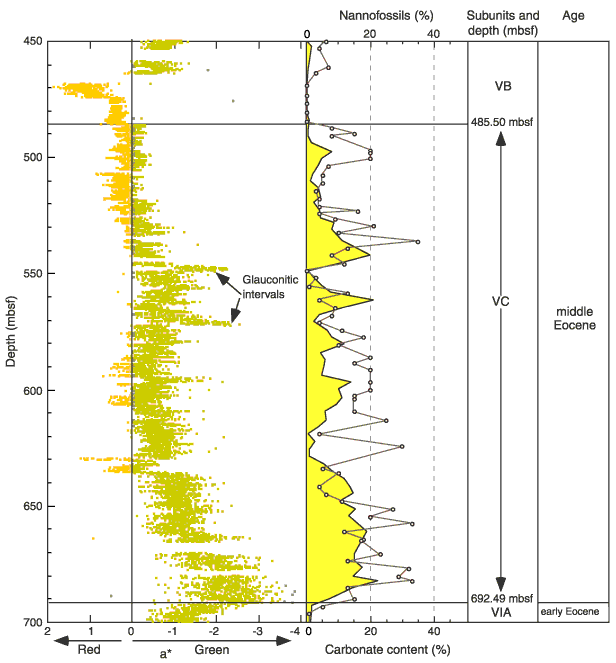
Figure F10. Comparison of chromaticity coordinate a* (green and red) from the photospectrometer to carbonate content (yellow shaded area) (see "Organic Geochemistry") and the nannofossil percent (gray circles) for 450-700 mbsf. Nannofossil percentages generally increase downsection in Subunit VC. Chromaticity coordinate a* indicates an increase in green and a decrease in red downsection and may be an indicator of changes in nannofossil and perhaps organic carbon contents. The two green peaks correspond to glauconitic intervals that are above the sequence boundaries at 550 and 572 mbsf.

![]()