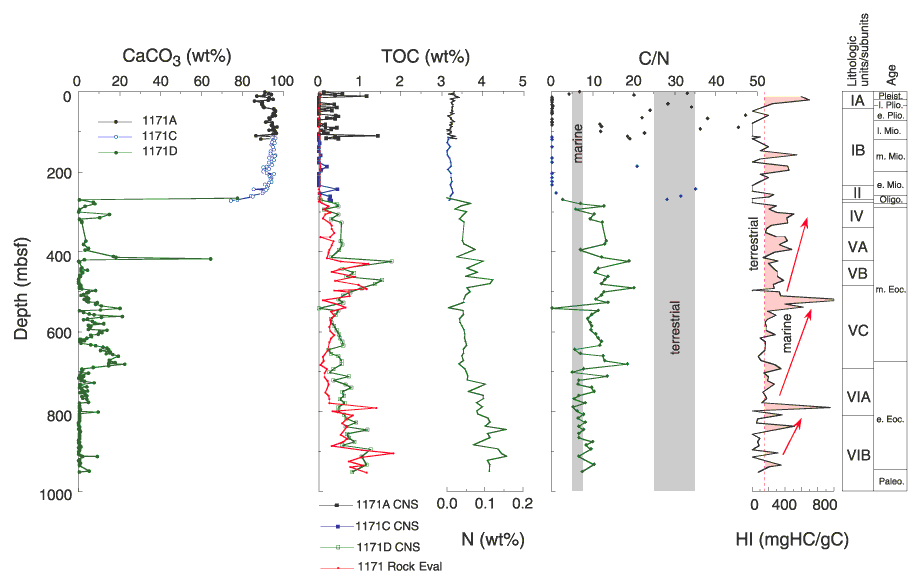
Figure F30. Plots of carbonate, total organic carbon (TOC) (squares = CNS analyzer data; dots = Rock-Eval pyrolysis values), total nitrogen, C/N ratios, and hydrogen index values for Site 1171. Data from Hole 1171A are presented in black, Hole 1171C data are shown in blue, and Hole 1171D data are in green. Shaded areas on the C/N ratio plot delineate typical marine and terrestrial organic matter fields. The shaded peak areas on the hydrogen index plot indicate marine organic matter. Lithostratigraphic and preliminary biostratigraphic units are on the right side of the figure.
![]()