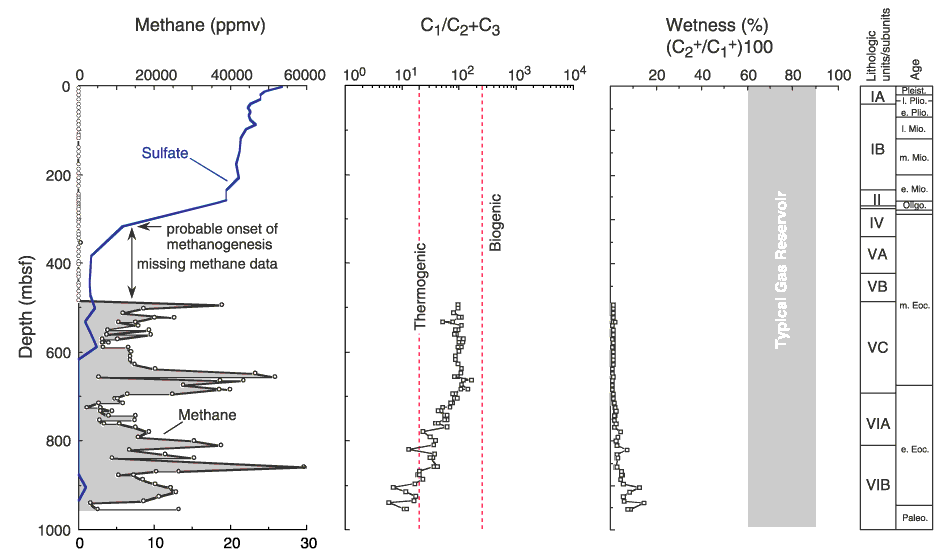
Figure F33. Methane (C1) and dissolved sulfate (SO42-) concentrations, methane vs. ethane plus propane ratio (C1/C2+C3), and the percent wetness ([C2+/C1+] × 100) from headspace gas analysis at Site 1171. Dashed lines delineate biogenic and thermogenic fields on the C1/C2+C3 plot (Hinz et al., 1986), whereas the shaded area on the percent wetness plot marks values typical for economically viable gas reservoirs. Lithostratigraphic and preliminary biostratigraphic units are indicated on the right side of the diagram.

![]()