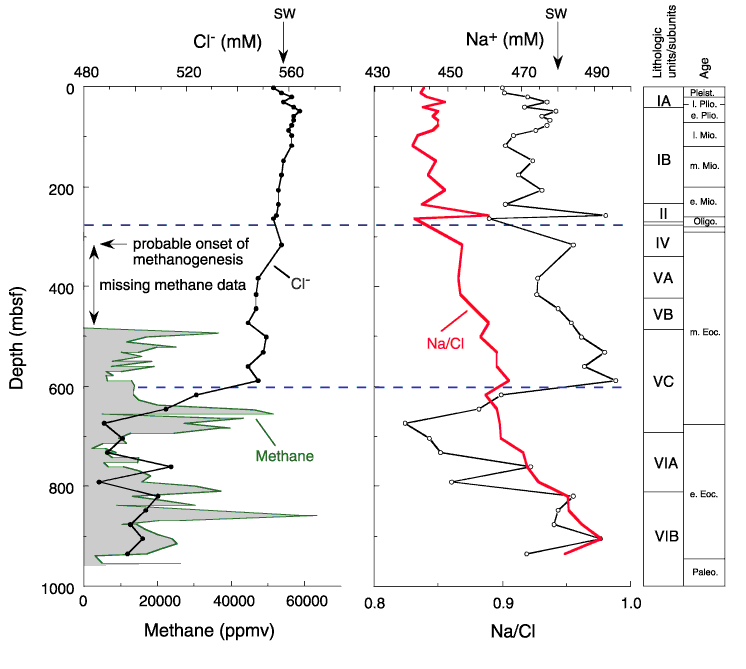
Figure F34. Concentration-depth profile of Cl- compared to methane (see "Volatile Hydrocarbons" in "Organic Geochemistry") and Na+ compared to Na+/Cl- ratios at Site 1171. Approximate locations of lithostratigraphic and biostratigraphic boundaries (see "Lithostratigraphy" and "Biostratigraphy") and standard seawater (SW) concentrations are indicated. Dashed lines mark depths of pronounced pore-water chemistry changes.

![]()