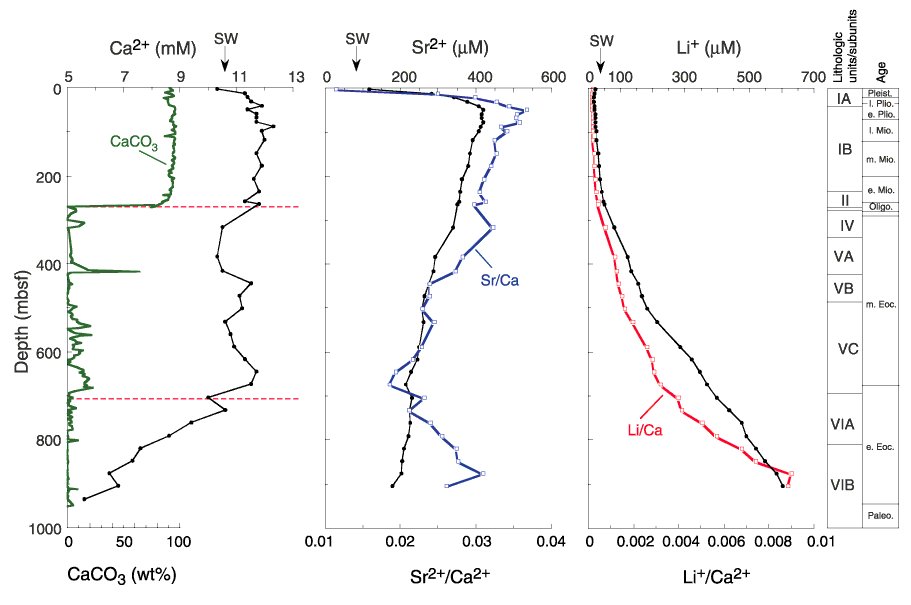
Figure F36. Concentration-depth profiles of Sr2+, Ca2+, and Li+ at Site 1171 with approximate location of lithostratigraphic and biostratigraphic boundaries (see "Lithostratigraphy" and "Biostratigraphy"). For comparison, CaCO3 content (see "Organic Geochemistry") and Sr2+/Ca2+ and Li+/Ca2+ ratios are plotted. Standard seawater (SW) concentrations are indicated.

![]()