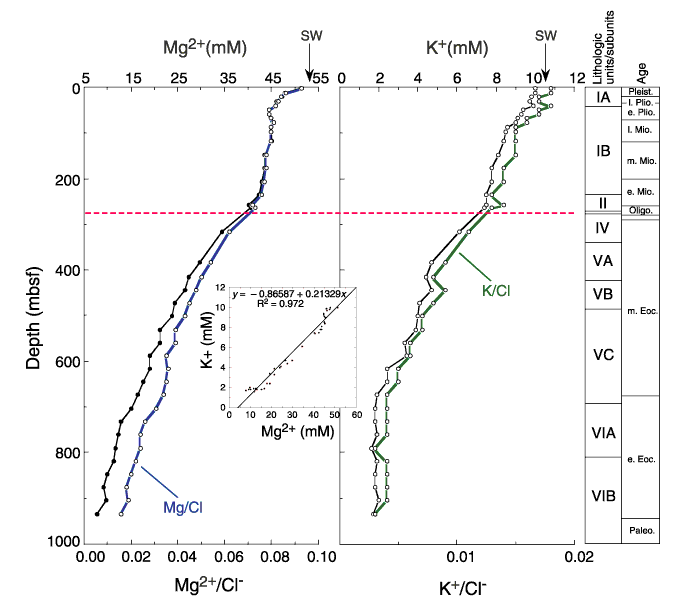
Figure F37. Concentration-depth profiles of Mg2+ and K+ at Site 1171. For comparison, Mg2+/Cl- and K+/Cl- ratios are plotted. The insert shows the high correlation between Mg2+ and K+. Approximate locations of lithostratigraphic and biostratigraphic boundaries (see "Lithostratigraphy" and "Biostratigraphy") and standard seawater (SW) concentrations are indicated. The dashed line marks depth of pronounced pore-water chemistry change.

![]()