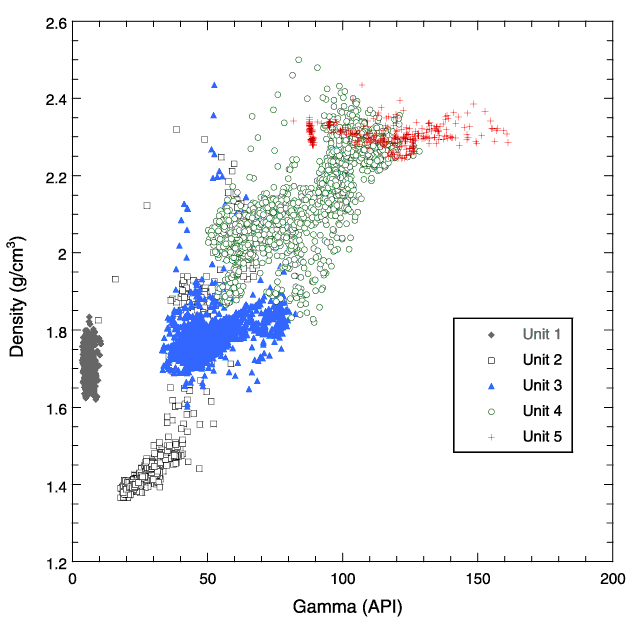
Figure F52. Downhole density plotted against natural gamma. The five log units (see "Log Units" in "Downhole Measurements" for details) tend to plot in different areas of the graph.