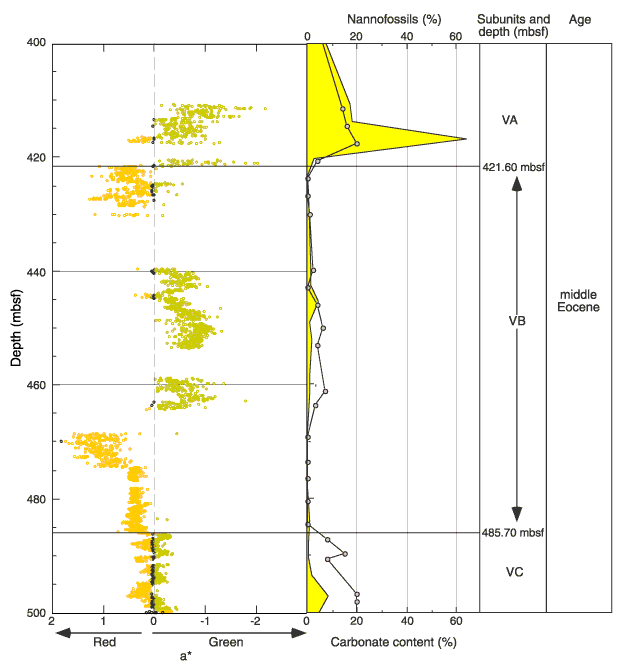
Figure F9. Comparison of chromaticity coordinate a* (green and red) from the photospectrometer to carbonate content (yellow shaded area) (see "Organic Geochemistry") and nannofossil percent (gray circles) for 400-500 mbsf. The comparison shows good agreement in increasing greenness and nannofossil and carbonate percentages. This relationship suggests chromaticity coordinate a* can be used as an indicator of nannofossil abundance. These changes in abundance may be caused by oscillations in the ventilation of the depositional environment. Although smear slides tend to overestimate nannofossil abundances (compared to carbonate content), both data sets show general good agreement.

![]()