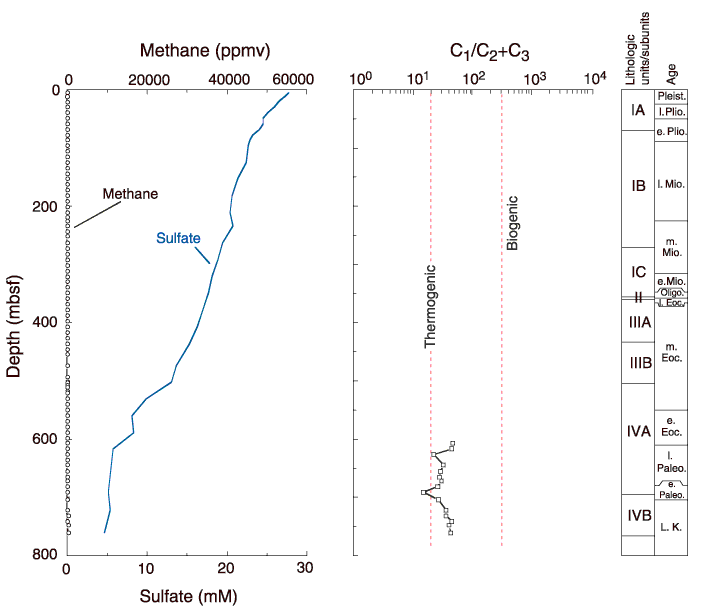
Figure F27. Methane (C1) and dissolved sulfate (SO42-) concentrations and methane vs. ethane plus propane ratio (C1/C2+C3) from headspace gas analysis at Site 1172. Dashed lines = biogenic and thermogenic fields on the C1/C2+C3 plot. Lithostratigraphic and preliminary biostratigraphic units are on the right side of the diagram.

![]()