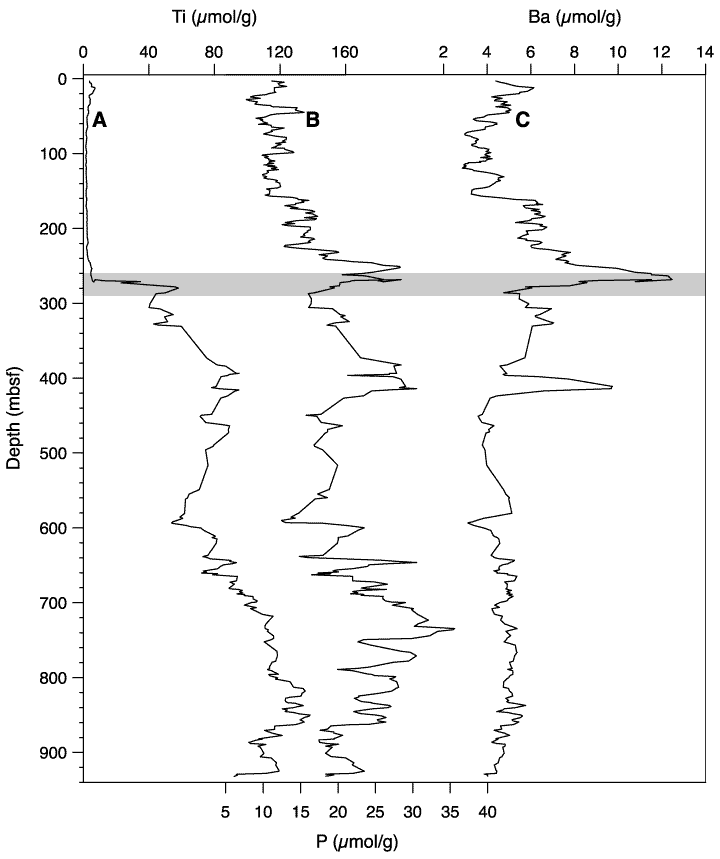
Figure F1. Downcore records of (A) Ti, (B) P, (C) and Ba. The gray-shaded area represents the Eocene-Oligocene transition. Data plotted have been smoothed using a 5-point moving average. See Table T2
for relative error and instrumental detection limits for elements analyzed.


![]()