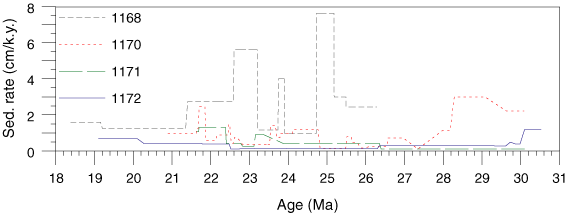
Figure F11.
Histogram depicting changes in sedimentation rates based on interpolation between datums listed in Table
T1
. Ages from Cande and Kent (1995).