![]() Figures
F1-F3
Figures
F1-F3
![]() Table T1-T5
Table T1-T5
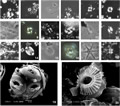
![]() Plate P1
Plate P1
F1. Location map.
F2. Combined Pleistocene zonal schemes.
F3. Sedimentation rate summary curves.
T1. Calcareous nannofossil range chart, Hole 1168A.
T2. Calcareous nannofossil range chart, Hole 1170A.
T3. Calcareous nannofossil range chart, Hole 1171A.
T4. Calcareous nannofossil range chart, Hole 1172A.
T5. Biomagnetostratigraphic datums.
P1. Key marker species.