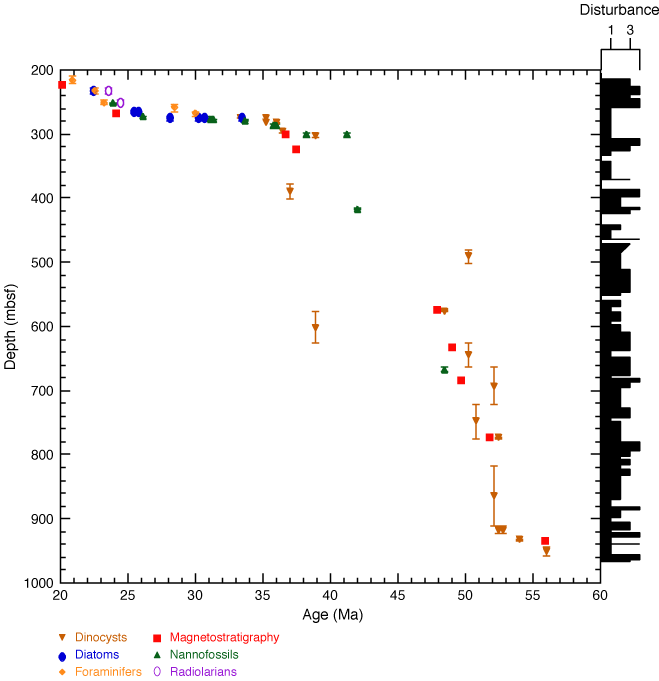
Figure F9. Age-depth plot, Site 1171, Paleogene. Core disturbance is shown in the right-hand column on an arbitrary scale of 1–4 (4 being the most disturbed intervals). All datums indicated in Table T1, Table T2, Table T3, and Table T4, (including alternative datums) are plotted to show scatter.


![]()