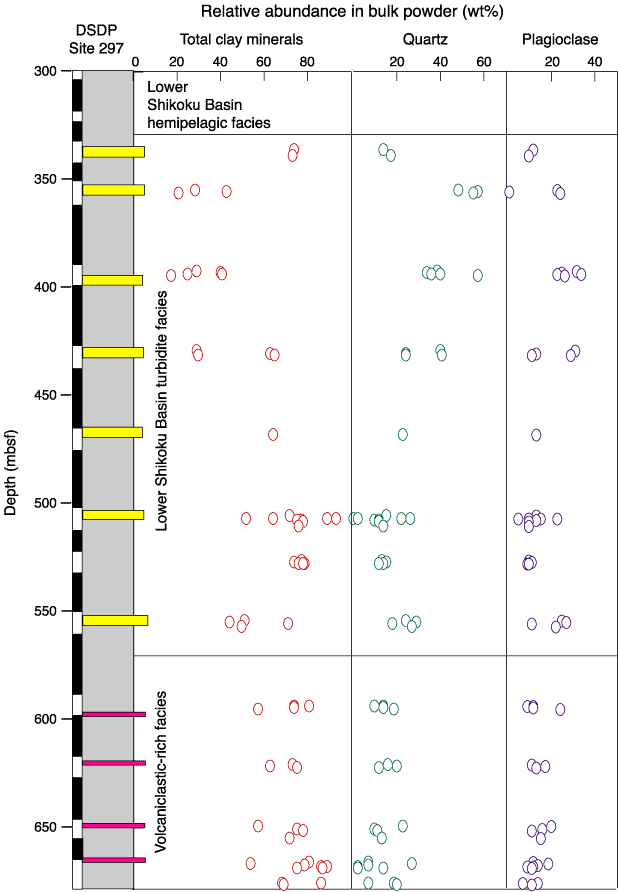
Figure F6. Results of X-ray diffraction analysis of random bulk powders from Site 297 of the Deep Sea Drilling Project. Data are tabulated in Table T7. See Figure F1 for location. Cored intervals are indicated in white to the left of stratigraphic column; intervals that were drilled ahead are indicated in black. Values of relative abundance (in weight percent) are based on the SVD (singular value decomposition) method using normalization factors shown in Table T4.


![]()