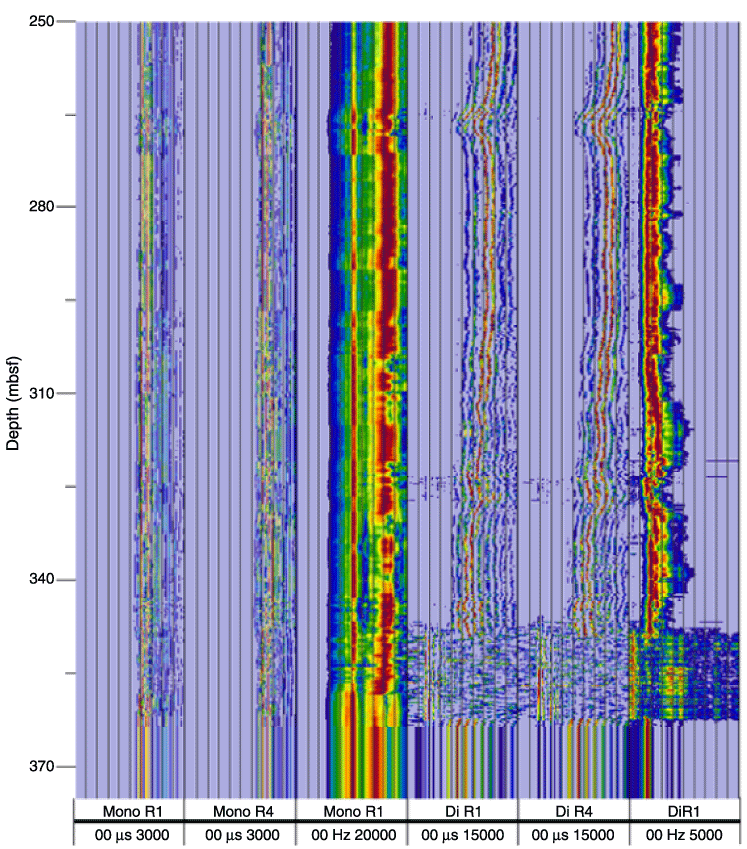
Figure F3. Time and frequency displays of wireline DSI data (pass 1) from ~250 to 350 mbsf in Hole 1173A. Red = high and blue = low acoustic energy over the 0- to 20-kHz frequency band. Much of the observed monopole energy above 10 kHz is not useful for P-wave processing. The dipole energy occurs below 1.5 kHz. Both data sets require filtering and processing to extract reliable velocity information.


![]()