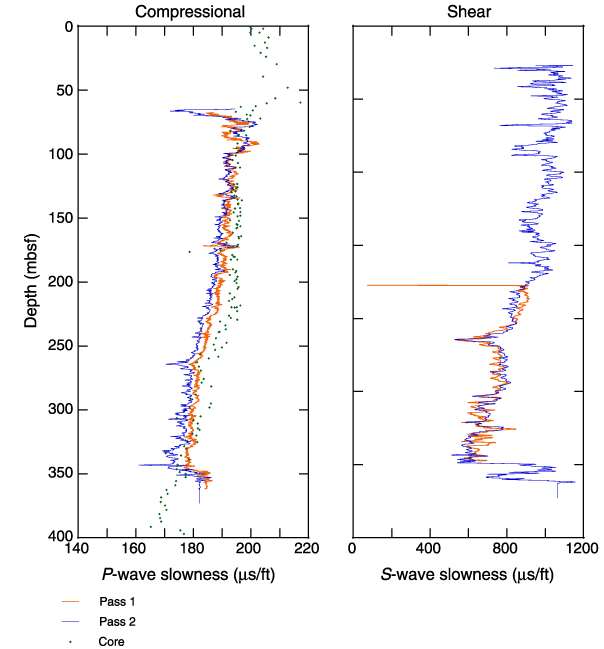
Figure F7. Comparison of reprocessed P- and S-wave slowness logs as a function of depth from pass 1 and pass 2. Core P-wave values are also shown. The trends of the two reprocessed P-wave passes and core data generally agree, but pass 2 is systematically 2-4 Ás/ft faster than pass 1 and 8-12 Ás/ft faster than the core values. The trends of the two reprocessed S-wave curves agree well over the overlapping interval.


![]()