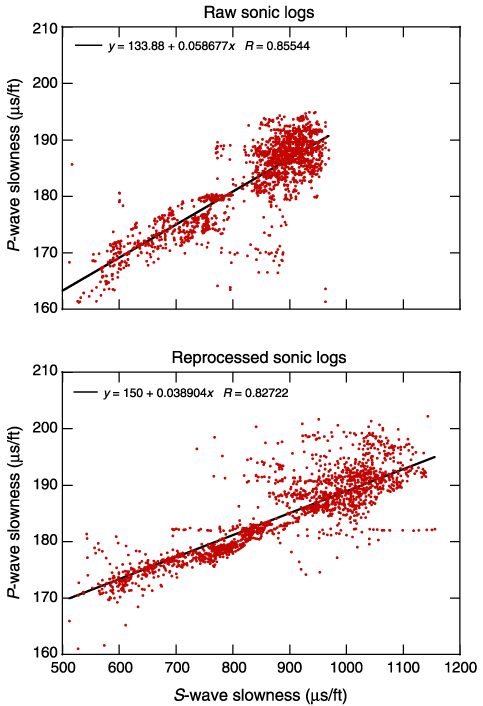
Figure F8. Crossplots of P- vs. S-wave slowness from both shipboard and reprocessed data. Linear regression of the reprocessed data yield the relationship DTc = 150 + 0.0389 DTs (R = 0.83). The average slope of this regression is 33% lower than that from shipboard results.


![]()