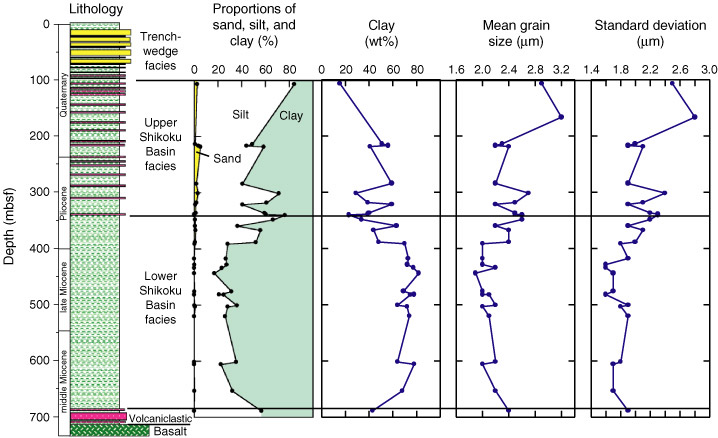
Figure F2. Lithostratigraphy, proportions of sand, silt, and clay by weight, mean grain size, and standard deviation of grain size with respect to depth for Site 1173. Sand was measured by sieve analysis. Other sizes were measured with a laser particle counter. The percent of particles <4 µm was converted to weight percent clay by use of an empirical correlation with settling analysis. Mean grain size and standard deviation were calculated from laser particle counter results. Horizontal lines show facies boundaries (after Shipboard Scientific Party, 2001b).